More often than not, data analysis involves linear regression. Scipy offers routines to calculate the regression parameters.

05 Mar 2021 - fubar - Sreekar Guddeti
More often than not, data analysis involves linear regression. Scipy offers routines to calculate the regression parameters.
Import the required packages. Also we shall use a custom matplotlib stylesheet
import numpy as np
from scipy import stats

import matplotlib as mpl
import matplotlib.pyplot as plt
mpl.style.use('myMatplotlibStylesheet.mplstyle')
Create 1D arrays for x and simulated error. For this use uniform() of random module of numpy. Create 1D array for y with a true value of slope equal to 2
x1D = np.arange(-10, 11, 1)

# generate error1D random numbers array
# of uniform distribution in [-1, 1)
error1D = np.random.uniform(-1, 1, 21)

# y 1D array
y1D = 2.0 * x1D + error1D
Perform the linear regression using linregress() method of stats module of scipy package. linregress() method returns a linregressResult instance
with attributes slope, intercept, rvalue, pvalue, stderr, intercept_stderr
result = stats.linregress(x1D, y1D)
For aesthetic presentation of the results, let us use f-strings and format the strings using format specification mini-language. If a is a string, f{a:10.6f} expression creates the string with padding so that total length is 10 characters and string is left aligned. If a is a number, the string is right aligned. For more examples, refer PyFormat
p = 'Parameter'
v = 'Value'
e = 'Error'

p1 = 'Slope'
p2 = 'Intercept'
p3 = 'r-value'
p4 = 'p-value'

# align the first column to the left {:10}
# whilst the second and third column to the rgight {:>10}

# list of f-strings
list_s = [30*'=',
          f'{p:10}{v:>10}{e:>10}',
          '-'*30,  # default alignment is right for numbers
          f'{p1:10}{result.slope:10.6f}{result.stderr:10.6f}',
          f'{p2:10}{result.intercept:10.6f}{result.intercept_stderr:10.6f}',
          f'{p3:10}{result.rvalue:10.6f}',
          f'{p4:10}{result.pvalue:10.6f}',
          '='*30
          ]
# string for parameters
params_s = ''
for each in list_s:
    params_s += f'{each}\n'
    print(each)
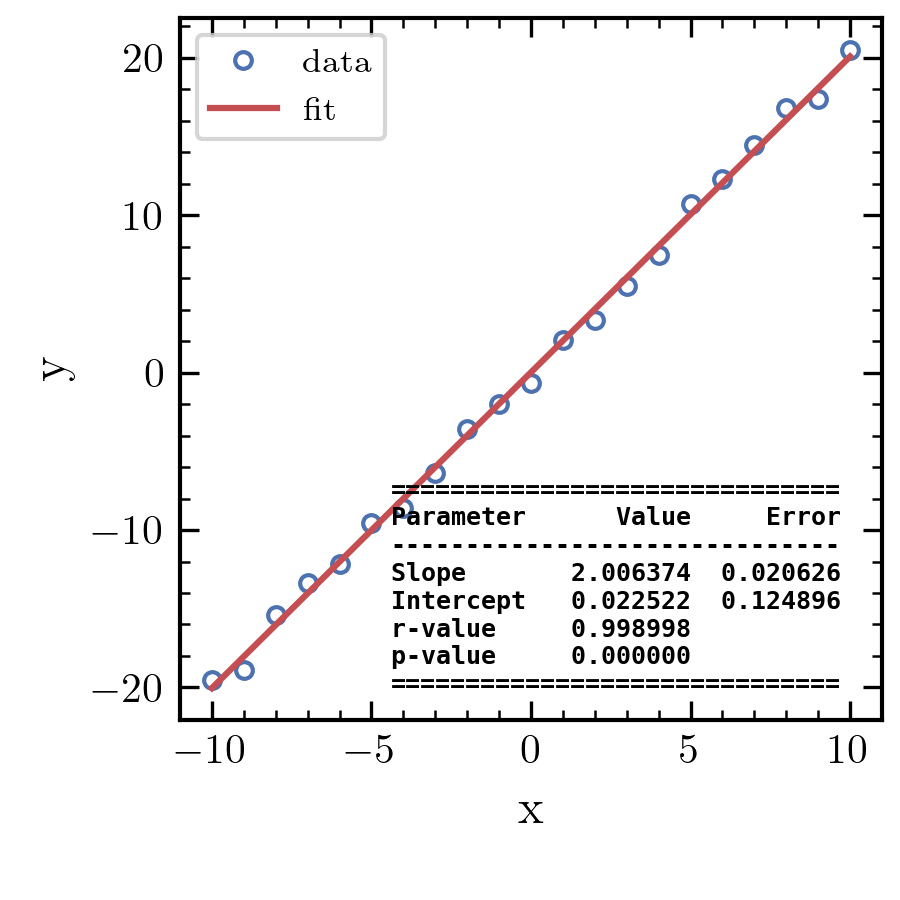
Running this code gives output
==============================
Parameter      Value     Error
------------------------------
Slope       2.006374  0.020626
Intercept   0.022522  0.124896
r-value     0.998998
p-value     0.000000
==============================
Now let us plot the data and the fit.
For proper indentation of the parameters, use monospace font for text object of plot and disable LaTeX.
# plot the data and fit with linear regression

fit1D = x1D * result.slope + result.intercept

fig, ax = plt.subplots()
ax.set_xlabel('x')
ax.set_ylabel('y')
ax.plot(x1D, y1D, 'o', label='data')
ax.plot(x1D, fit1D, '-', label='fit')
ax.legend()
ax.text(0.3, 0.0, params_s, transform = ax.transAxes, fontsize = 6, family = 'monospace', usetex = False)
fig.savefig('linearRegression.png')