 In addition to using LaTeX rendering, we can customize the LaTeX preamble by adding packages. These packages are set via the rcParams dictionary.

03 May 2021 - fubar - Sreekar Guddeti
In addition to using LaTeX rendering, we can customize the LaTeX preamble by adding packages. These packages are set via the rcParams dictionary.
The standard LaTeX distribution includes the eqnarray environment to align math-text. However, it produces underpar results when used in matplotlib. A better solution is the align environment provided by the amsmath package.
Align vs eqnarray environmentsSince amsmath is not included in the standard LaTeX distribution, it needs to be imported via usepackage{amsmath} directive in the preamble of the LaTeX document. Matplotlib’s rcParams dictionary provides a configuration key text.latex.preamble to set this and similar directives.
The rcParams dictionary is defined in the rcParams file located at
In [162]: import matplotlib as mpl
In [164]: mpl.matplotlib_fname()
Out[164]: 'C:\\Users\\fubar\\anaconda3\\lib\\site-packages\\matplotlib\\mpl-data\\matplotlibrc'
A portion of this file reads
## ***************************************************************************
## * LaTeX                                                                   *
## ***************************************************************************
## For more information on LaTex properties, see
## https://matplotlib.org/tutorials/text/usetex.html
#text.usetex: False  # use latex for all text handling. The following fonts
                     # are supported through the usual rc parameter settings:
                     # new century schoolbook, bookman, times, palatino,
                     # zapf chancery, charter, serif, sans-serif, helvetica,
                     # avant garde, courier, monospace, computer modern roman,
                     # computer modern sans serif, computer modern typewriter
                     # If another font is desired which can loaded using the
                     # LaTeX \usepackage command, please inquire at the
                     # matplotlib mailing list
#text.latex.preamble:   # IMPROPER USE OF THIS FEATURE WILL LEAD TO LATEX FAILURES
                        # AND IS THEREFORE UNSUPPORTED. PLEASE DO NOT ASK FOR HELP
                        # IF THIS FEATURE DOES NOT DO WHAT YOU EXPECT IT TO.
                        # text.latex.preamble is a single line of LaTeX code that
                        # will be passed on to the LaTeX system. It may contain
                        # any code that is valid for the LaTeX "preamble", i.e.
                        # between the "\documentclass" and "\begin{document}"
                        # statements.
                        # Note that it has to be put on a single line, which may
                        # become quite long.
                        # The following packages are always loaded with usetex, so
                        # beware of package collisions: color, geometry, graphicx,
                        # type1cm, textcomp.
                        # Adobe Postscript (PSSNFS) font packages may also be
                        # loaded, depending on your font settings.
Let us set these keys to include the amsmath package.
import matplotlib as mpl
custom_preamble = {
    "text.usetex": True,
    "text.latex.preamble": r"\usepackage{amsmath}", # for the align enivironment
    }

mpl.rcParams.update(custom_preamble)
Set up the figure.
fig, ax = plt.subplots()
ax.set_label('x')
ax.set_ylabel('y')
Use eqnarray environment
ax.text(0.2, 0.9, r'eqnarray environment')
ax.text(0.2, 0.8, r"\begin{eqnarray*}f(x) &=  \sin x \\ &= \sin^2 (x) \end{eqnarray*}", transform= ax.transAxes)
Use align environment
ax.text(0.2, 0.3, r'align environment')
ax.text(0.2, 0.2, r"\begin{align}f(x) &=  \sin x \\ &= \sin^2 (x) \end{align}", transform= ax.transAxes)
The array environment to typset matrices and table work well in matplotlib.
ax.text(0.3, 0.6, r'array environment')
ax.text(0.3, 0.5, r"$$ |x| = \left\{ \begin{array}{rl} -x & \text{if } x < 0,\\ 0 & \text{if } x = 0,\\ x & \text{if } x > 0. \end{array} \right. $$", transform= ax.transAxes)
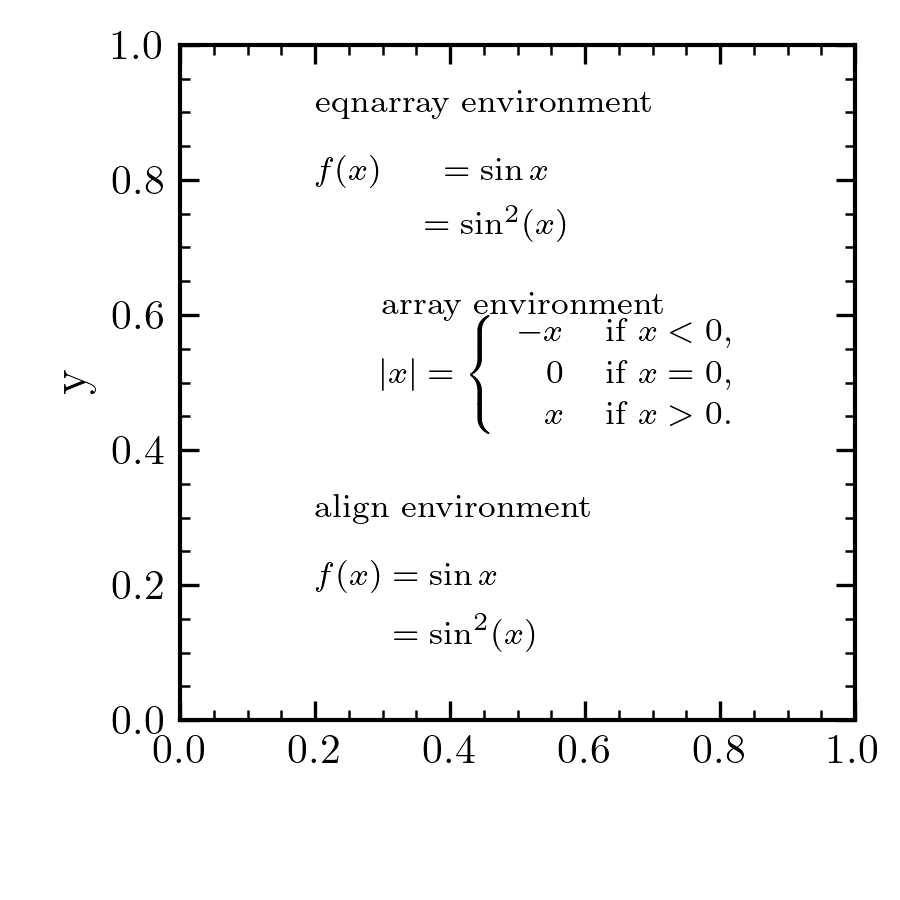
So it is appropriate to use amsmath package.